Predicting the Survival of Titanic Passengers.
The Task
Based on the data provided of 891 passenger records, determine what factors (age, sex, class, etc.) may be influential in a model to determine passenger survival of the titanic disaster.
The Methods
I was asked to review the data, wrangle any necessary aspects of the data and use it to evaluate several different Classification Models. Specifically, we were classifying Survived (1) vs. Perished (0).
The models which we will look at include:
- LogisticRegression
- DecisionTreeClassifier
- BaggingClassifier
- KNeighborsClassifier
I will be implementing GridSearchCV in order to find the optimal parameters. And visualizing the performance of the model using ROC Curve plots and AUC scores.
The Process
I began the process by using psycopg2 to make an SQL connection to the database which held the data and pulled it down into a pandas dataframe.
With the data safely in hand, I ran some descriptive queries to get a feel for the data. I found that several fields were missing information. For example the field cabin had a substantial amount of data missing In this specific case, I opted to discard the field rather than attempt to fill it in. In the case of age which had about 180 missing values, I chose to grab a random value from the known ages to fill in the missing data.
The full data dictionary is show below (from the Kaggle description)
VARIABLE DESCRIPTIONS:
survival        Survival
                (0 = No; 1 = Yes)
pclass          Passenger Class
                (1 = 1st; 2 = 2nd; 3 = 3rd)
name            Name
sex             Sex
age             Age
sibsp           Number of Siblings/Spouses Aboard
parch           Number of Parents/Children Aboard
ticket          Ticket Number
fare            Passenger Fare
cabin           Cabin
embarked        Port of Embarkation
                (C = Cherbourg; Q = Queenstown; S = Southampton)

SPECIAL NOTES:
Pclass is a proxy for socio-economic status (SES)
 1st ~ Upper; 2nd ~ Middle; 3rd ~ Lower

Age is in Years; Fractional if Age less than One (1)
 If the Age is Estimated, it is in the form xx.5

With respect to the family relation variables (i.e. sibsp and parch)
some relations were ignored.  The following are the definitions used
for sibsp and parch.

Sibling:  Brother, Sister, Stepbrother, or Stepsister of Passenger Aboard Titanic
Spouse:   Husband or Wife of Passenger Aboard Titanic (Mistresses and Fiances Ignored)
Parent:   Mother or Father of Passenger Aboard Titanic
Child:    Son, Daughter, Stepson, or Stepdaughter of Passenger Aboard Titanic

Other family relatives excluded from this study include cousins,
nephews/nieces, aunts/uncles, and in-laws.  Some children travelled
only with a nanny, therefore parch=0 for them.  As well, some
travelled with very close friends or neighbors in a village, however,
the definitions do not support such relations.
I made 2 new columns for convenience - **Age group .. ** - CHILD if age was less than 13 - ADULT if age 13+ - **Party Size .. ** - (S)mall if less than 2 people according to SIBSP + PARCH + 1 - (M)edium if 2-4 people in the Party - (L)arge if more than 4 people in the Party
The Story
I then created a few violin plots which depicted various features vs. Survival.
 You can surmise from the above that Males tended to perish while Females were split.
 You can surmise from the above that people in Small or Large parties were likely to perish.
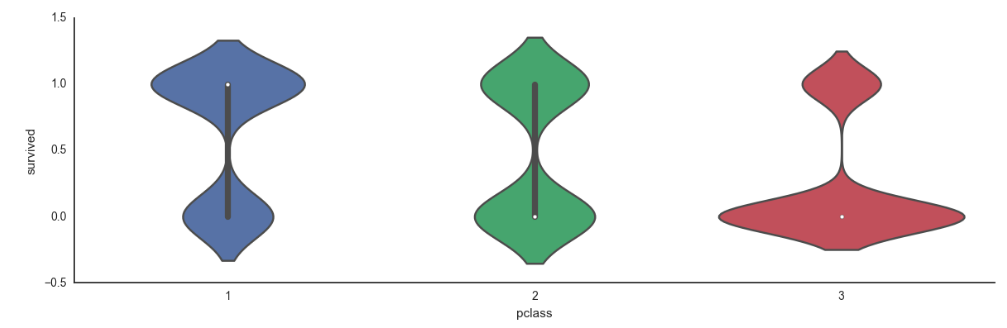 Generally speaking, things were not optimistic as a 3rd class passenger.
The visuals above were equally reflected in the coefficients of the LogisticRegression model (below). Males were strongly negatively weight, followed by 3rd Class. Party size was also quite influential in the weightings. Perhaps singles were altruistic in giving up their life boat seats and perhaps large parties couldn’t get their act together.
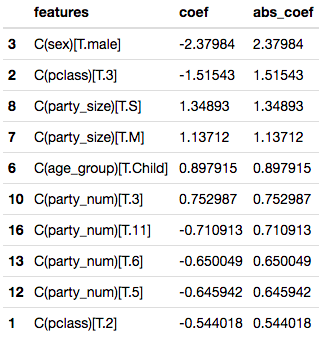
It should come as no surprise that the Women and Children were more likely to be survivors as that is the common “rule” for a maritime disaster.
The Models
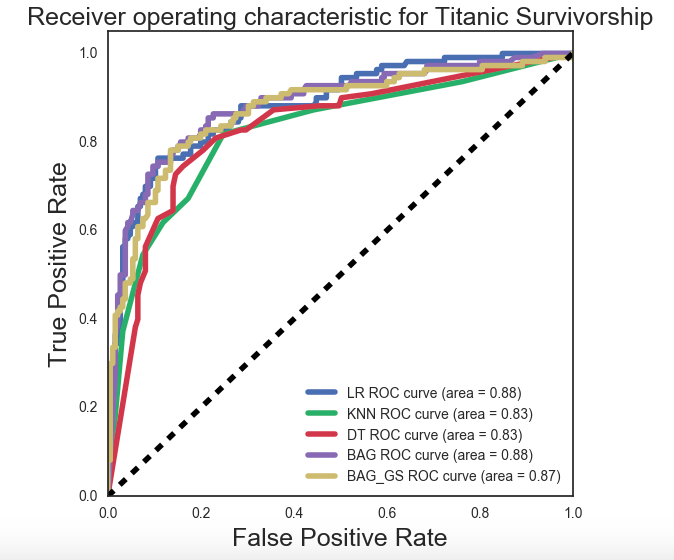
I was able to, with some good success, develop a feature set which lent well to testing with various models. When comparing different classification models, looking at the model’s ROC curve and Area Under the Curve (AUC) score is quite helpful.
The desire is to have an AUC of 1.00. This corresponds to having 100% True Positives and no False Positives. The shape of the ideal curve would be to be pulled to the far upper left corner with a long flat plateau to the right corner.
On the curve below, we have plotted 5 different model variants. Beginning with a plain vanilla, LogisticRegression (AUC 0.88) moving to a KNN Model and several Tree based models. The DecisionTree model with BaggingClassifier seems to perform equally best alongside the standard LogisticRegression