The Snake is your Friend .. Introduction to Python for Data Science – An analysis of State Based SAT scores 2001
The project this week was meant as an introduction to Python data analysis and visualization. It required me to:
- create several different Python list [] and dictionary {} data structures
- manipulate Python dictionaries using “list comprehensions”, unpacking and “for loops”
- slice and select subsets of the full data set
- perform simple descriptive statistics on the data (min, max, mean, median, standard deviation)
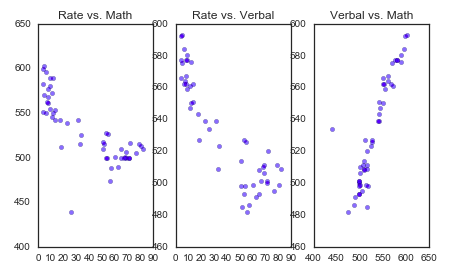
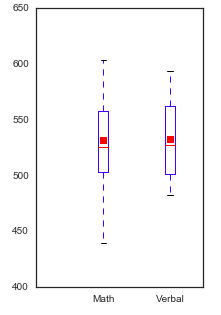
- create scatterplots, histograms, box plots and heatmaps with MatPlotLib, PyPlot, Seaborn and Tableau to visualize the data
Note: The methodology below is drawn from the “Data Science Workflow” document provided by General Assembly
IDENTIFY THE PROBLEM
The College Board would like to analyze the State based data of the 2001 SAT scores.
ACQUIRE THE DATA
The data as provided to us as a csv file. It is 4 columns wide by 53 rows (including header labels and national averages). The data dictionary begins.
“satscores.csv”_The data is delimited with commas The data was clean but needs to have some fields types recast
1 header row of the following values: State, Rate, Verbal, Math
State – string, State of the testing
Rate – float, percentage of participation for that ‘state’
Verbal – float, Average value of Verbal Score within that State
Math – float, Average value of Math score within that State
NOTE1: there is also a ‘summary’ row denoted by “All” in the State column which represents the national averages
NOTE2: Washington, DC is treated as a “State”
PARSE THE DATA
The csv data was brought into Python as a list of lists and converted to a properly typed dictionary data structure. Several different dictionaries were created for various functional reasons.
MINE THE DATA
The data was statistically described using mean, standard deviation, minimum and maximum for each of the numeric columns of the dataset.
REFINE THE DATA
The data provided did not require further refinement
BUILD A DATA MODEL
There was no need to build a data model for this project.
PRESENT RESULTS
Description of results forthcoming.

DEPLOY AND VALIDATE
There was no need to deploy nor validate functions, methods nor algorithms for this project.