Billboard’s Hot100 .. Is June as Hot as Hyped?
The project this week was meant to build upon our growing proficiency in Python, especially Pandas. The project also drove home the statistical concepts of Study Design, Hypothesis Testing, T-statistics, P-Values as well as Data Cleaning and EDA (Exploratory Data Analysis)
Specifically the project required me to:
- consider whether the Data presented was best suited for the question I was asking
- explore the data and consider it’s shortcomings and possible workarounds
- clean the data, as necessary
- make smart, informed decisions about any alterations I may have made to the data
- develop a testable hypothesis within the constraints of the data and project timeline
- utilize visual and statistical techniques to assert and test my hypothesis
- use new functionality of python including pd.apply{map}, pd.groupby, pd.pivot_table, scipy.ttest
Note: The methodology below is drawn from the “Data Science Workflow” document provided by General Assembly
IDENTIFY THE PROBLEM
NULL-HYPOTHESIS:
Between Jan 1999 and December 2004, the mean of the overall weeks (lifetime) for a song to appear on the Hot100 list which Debuts on the list in the month of June is no different than the mean lifetime of a song which debuts in any other month.
Risks and Assumptions
The methodology of Hot100 Billboard Charts data is notoriously wrought with problems. Throughout it’s history, Billboard has changed their policies regarding both the way they collect the information as well as which information they are collecting.
At some points in history they have collected the sales of Singles, then sales of Albums, then sales of downloads. Additionally, they collect data on how often a song is played on the radio (airplays). Most recently, they have made adjustments to account for streaming music. Wikipedia and other online sources discuss the inherent fragility of the data in more depth.
Needless to say, exactly what data you are analyzing has much to do with the period of time the data represents.
ACQUIRE THE DATA
The dataset which was originally presented consisted of 317 rows of data from the year 2000. After some exploratory data analysis, it was determined that the sample was too small for adequately testing the hypothesis.
A larger dataset was found which included over 300,000 rows of data spanning all years of the Billboard Hot 100 charts. The dataset is available here in Pipe Separated Format (PSV). The important thing to note for this new dataset was that song titles were repeated rows for each week that they were on the charts. Therefore, a pivot table was used to flatten the repeated rows to 1 record per song using MAXimum ‘overall weeks on chart’. In addition, there were some songs which had slight variations in their titles and therefore were counted multiple times in the dataset.
A full description of the dataset can be found below.
- Name: all_billboard_data.txt
- Delimiter: “|”
- Records: 343545
- Sources: web scraped by Michael Kling from the ultimate music database
- Previously used: Modest Insights - Analyzing the Billboard Hot 100
- Columns:
- pos - current position on chart - integer
- last week - position on chart previous week - integer
- peak - lifetime peak position on chart - integer
- weeks on chart - number of weeks on chart - integer
- title - song title - string
- artist - song artist -string
- chart entry date - data song debuted on chart (days since 1900) - float
- entry position - initial position debuted on the chart - integer
- overall peak - total lifetime peak position - integer
- overall weeks on chart - total lifetime weeks on chart - integer
- chart date - date of this chart’s week - YYYYMMDD
PARSE THE DATA
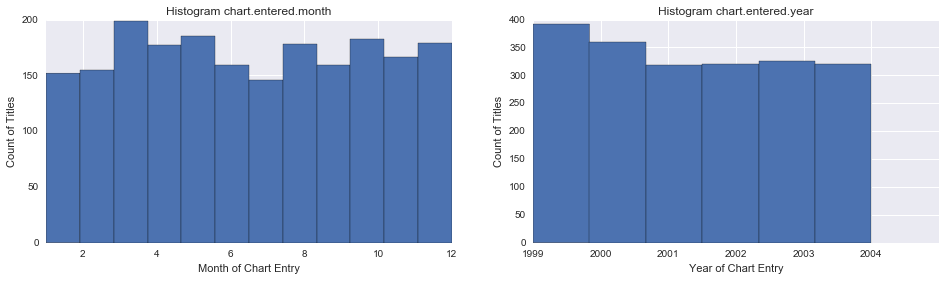
Due to the issues noted above with regard to the different historical policies of Billboard’s data collection, it was determined that we should concentrate on a relatively calm period of Billboard policy changes between January 1999 and December 2004. There had been a major change in policy in November 1998 and another major change in February 2005.
Using the pandas library of Python, the data was imported as a csv using the “|” delimiter. The data was manipulated to change the Excel Formatted date in “chart entry date” column to become “chart.entered.date”, a datetime field. From that field, 2 other fields were derived “chart.entered.month” and “chart.entered.year”.
As noted above, because individual songs were recorded for each week they appeared on the charts, a pivot table was used to “flatten” the data using the the MAXimum of “overall weeks on chart”.
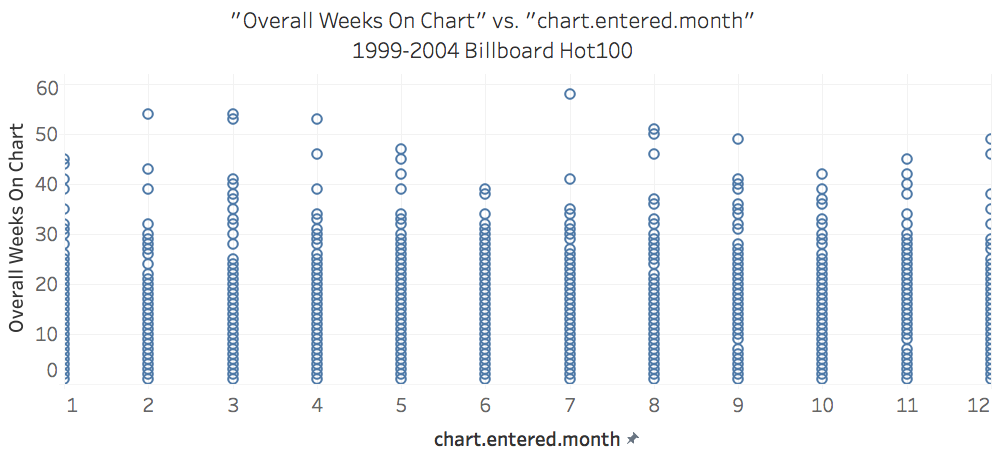
After selecting the subset of the years (1999 - 2004), and flattening the titles and dropping the resulting pivot table column (level_0), we are left with 2038 records and 4 columns of interest (title, chart.enter.month, chart.enter.year, overall weeks on chart)
MINE THE DATA
The data was statistically described using mean, standard deviation, minimum and maximum for each of the numeric columns of the dataset.
REFINE THE DATA
The data provided did not require further refinement
BUILD A DATA MODEL
There was no need to build a data model for this project.
PRESENT RESULTS

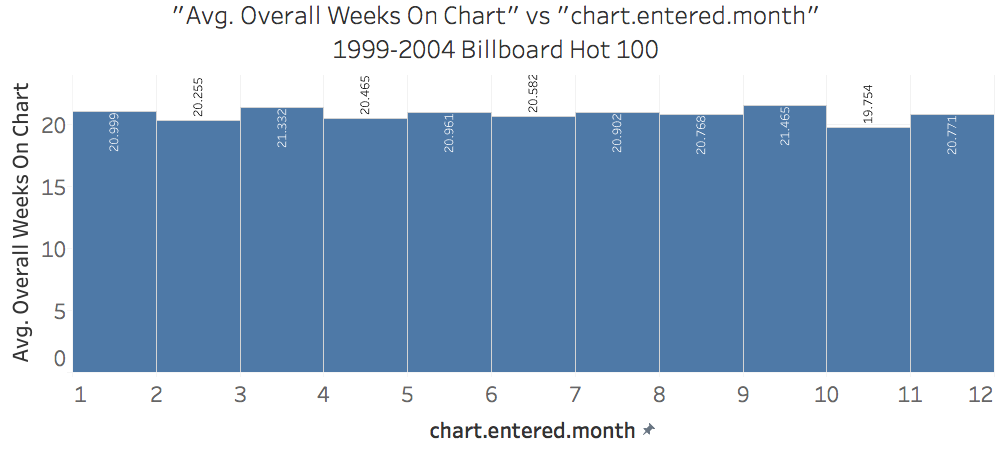

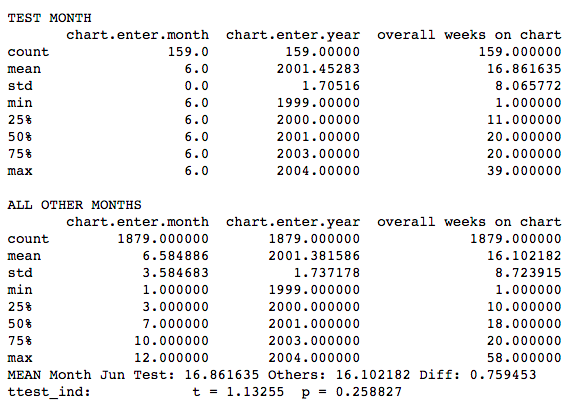
The NULL-HYPOTHESIS is that a Song which Debuts in June has no extra staying power over a song which debuts in a different month.
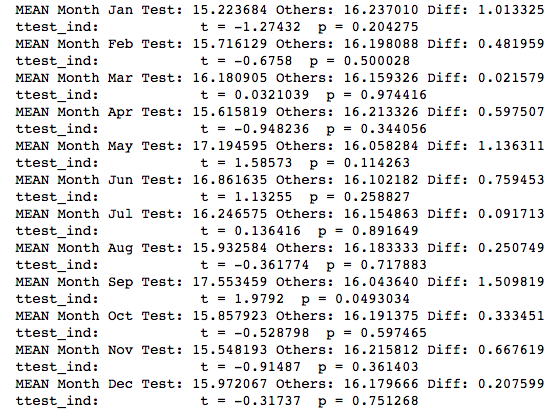
Based on the above calculations, this should be apparent. The difference between the means = 0.75. We ran a ttest_ind calculation which confirms that we may not reject the NULL-HYPOTHESIS because it’s value is.
In fact, it turns out that there is no particular month that any song should aim for. It is not true, based on our analysis that debuting on the charts in a particular month provides any advantage with regard to lifetime on the charts.
DEPLOY AND VALIDATE
There was no need to deploy nor validate functions, methods nor algorithms for this project.